Revenue forecasting allows you to set projections for what you intend to invoice projects for future months. Once forecasts have been entered, they can be accessed from a number of places in Projectworks - dependent on what information you are after.
At a high level, the forecasting reports provide the following information:
- The amount which is forecast to be invoiced
- Access to the change log where details of forecast changes can be viewed
- The projected "burn" for the month (burn = worked effort up to and including today + value of remaining resourcing); and
- The delta between forecast amounts and projected burn.
Forecasts can not be edited from any of the reports, with forecasts being managed from the forecast screens within a project or the My forecasts or All Forecasts screen.
Before covering the three forecast reports, it is important to cover off some key concepts which are common to all reports. The project forecasting report, company forecasting report and forecasting report for an individual company are based on the same set of data and calculations, but are summarised/grouped to a different level of granularity.
Covered in this article are:
- Key concepts
- Company forecasting report
- Projects forecasting report
- Forecasting for an individual company
- Forecast for an individual project
Key concepts common to the forecasting reports
Projected Burn
A key concept to understand is projected burn as it is an important part of the forecast reports. It is calculated the same way across each of the reports.
Projected burn is used to predict the value of work that will be recorded on a project in a month. It is calculated as:
Worked + Resourced = Projected Burn
- Worked is the value recorded in timesheets up to and including today
- Resourced is the value of resourcing remaining to the end of the month
The current week portion uses a mix of time entries and the balance of any remaining resourcing - adding the time entries multiplied by billable rate for the timecodes up to and including today for each person to the balance of any remaining resourcing for each person to the end of the week multiplied by their standard project billable rate.
A person’s billable rate may differ dependent on the timecode that they log time entries for in a project, however their resourcing billable rate is per project.
e.g. If a Project has a billable timecode and a non-billable timecode, and a person is resourced to the Project for 40 hours at a default billable rate of $100 p.h. the resourced value is $4,000, however if the Person logs 8 hours on Monday on the non-billable timecode:
Projected burn on Monday for the week is = $3,200 ((8*$0)+(32*$100))
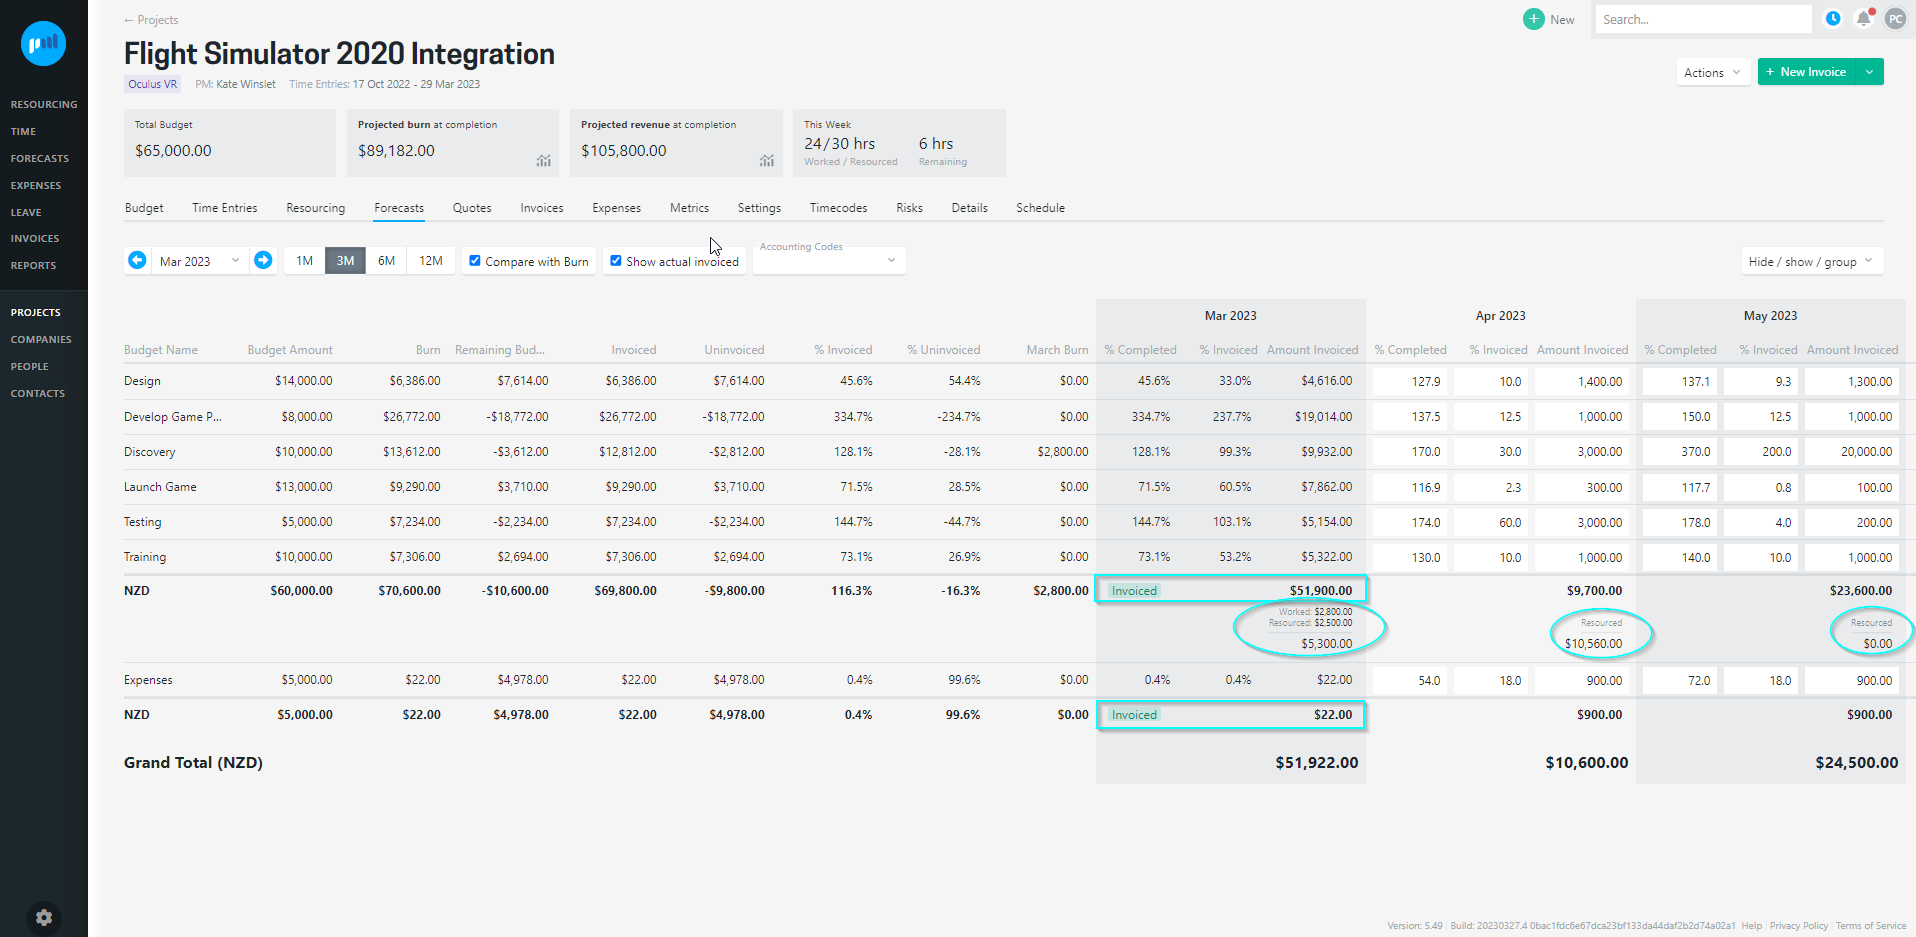
Each projected burn calculation can be seen by hovering over the figure in the projected burn column. As well as showing the worked and resourced values it also shows the total value worked for the month (which includes effort worked up to and including today for the current week).
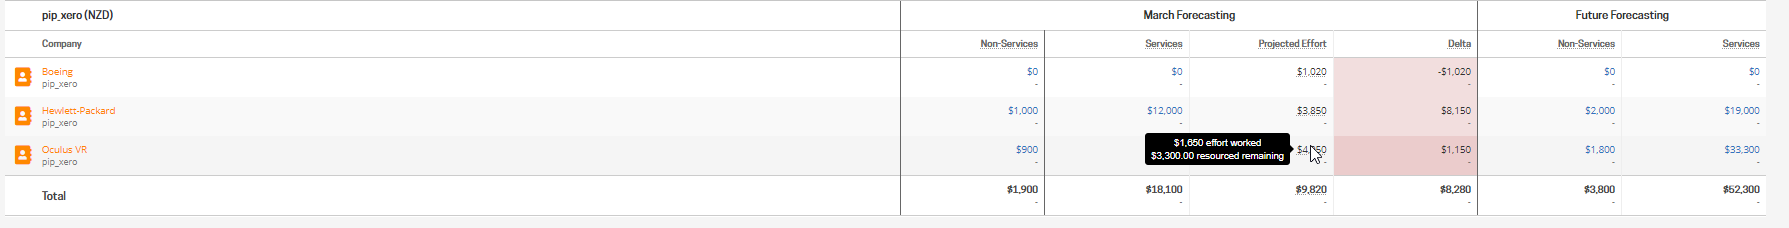
The effort worked value is calculated by using the rate from the timecode.
The resourced remaining value is calculated by multiplying the remaining resourced hours for each person by the default billing rate set for them on the project.
Delta between forecast & projected burn
The Delta is used to identify where there is a difference between what the services forecast to be invoiced and the expected value of effort to occur in the month:
- Services Forecast - Projected Burn = Delta
Services Forecast is the sum of the monthy forecasts for the services budgets for the project.
The various components of the calculations are made up of:
- Services Forecast is the value forecast against services modules, including any services discounts
- Projected Burn is the value of worked + remaining resourcing
- Accrued is the balance of any accruals into (and out of) the month, against services modules
- Discount is the value of any forecasts against modules with a services discount GL Code
Future forecasting
The forecasting reports are focused on a single month to help validate that forecasts align to the worked + resourced effort. The screens do also provide a high level forward view, showing the total forecast for all future months. The future forecasts are shown to the right of the table, providing an indication of expected future revenue for projects and companies.
If you change the month that the report is for the future forecast amounts will update accordingly.
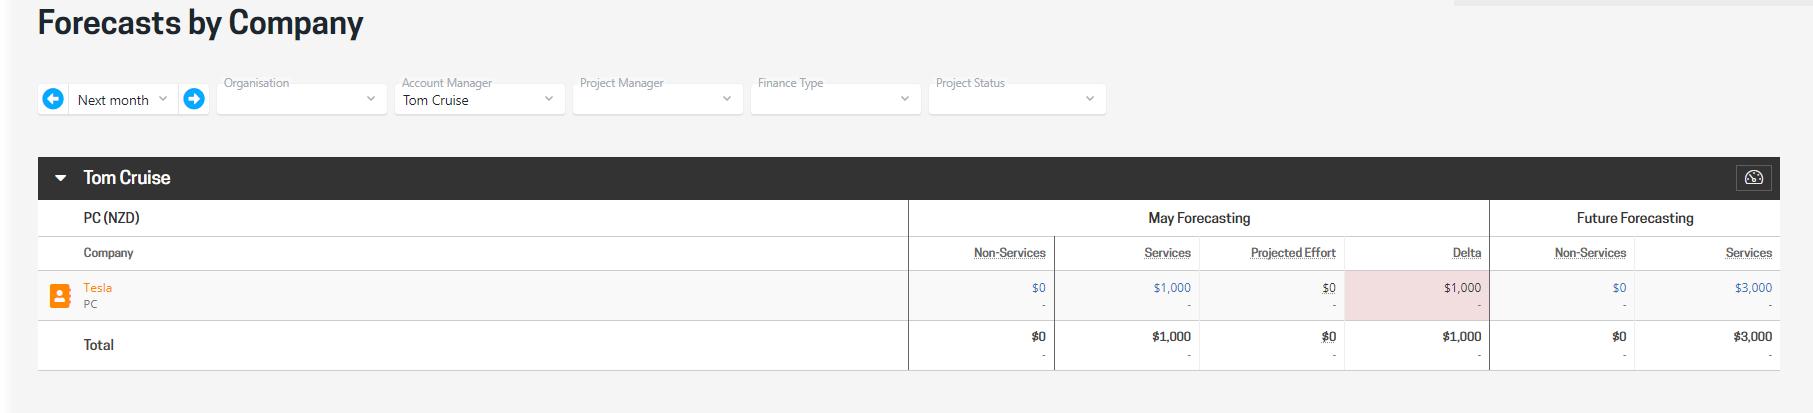
e.g. A budget has $1,000 per month forecast for April through to August.
- If I am viewing the forecast in April, April forecasting will be $1,000, and future forecasting will be $4,000
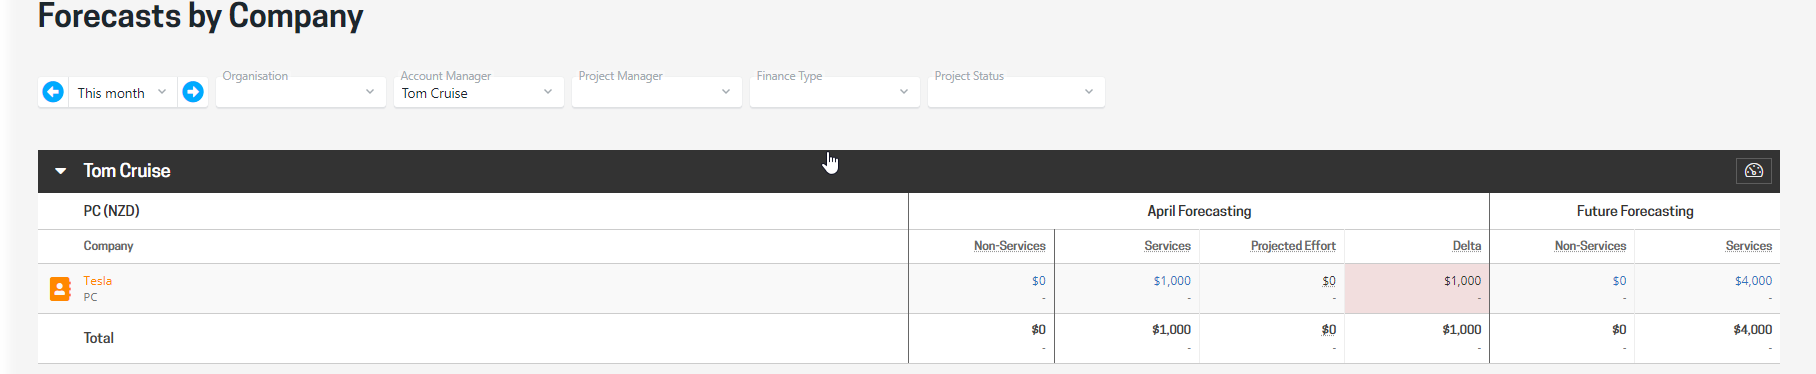
- If I change the forecast to May, May forecasting will be $1,000, and future forecasting will be $3,000
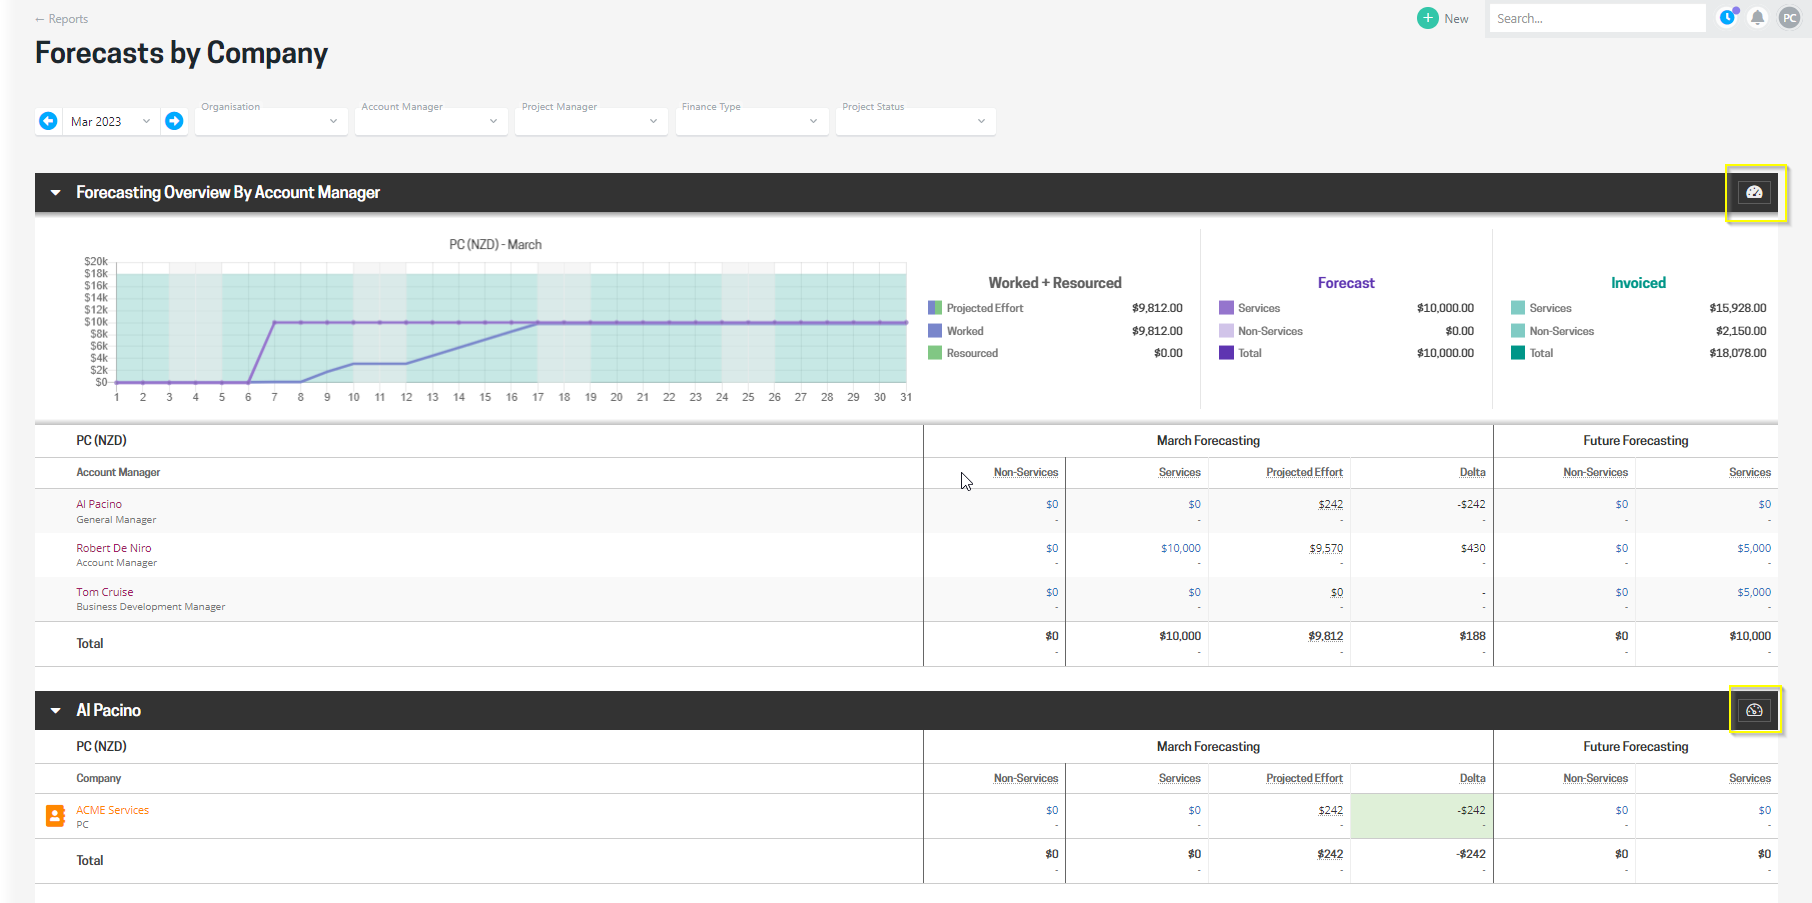
Graphs and summary data
Each of the report screens includes graphs and summary data. The graph combines a forecast worm tracking alongside work effort and resourcing. The forecast worm is updated each day with a snapshot of the forecast amount for each project, which shows how forecasts change over the course of a month.
All information shown (including the graph and summary data) on the report screen is based on the filtered criteria. By filtering to an organisation, account manager, or project manager you can focus on a portfolio of work.
Graph
The graph plots:
- the forecast amount for each day of the month;
- the value worked (in timesheets) up to and including the current date;
- The cumulative value of remaining resourcing through to the end of the month; and
- the total invoiced amount.
Summary data
To support the graph, totals are shown for worked, resourced, forecast, and invoiced.
| Worked + Resourced | Forecast | Invoiced |
| Projected Effort is the value of Worked to date + Resourced | Services is the total value forecast against services budgets. | Services is the total value invoiced against services budgets. |
| Worked is the value worked (in timesheets in timesheets up to and including today) | Non-services is the value forecast against non-services budgets | Non-services is the value invoiced against non-services budgets |
| Resourced is the value of remaining resourcing | Total is the value of forecasts for services and non-services | Total is the value of invoices for services and non-service |
Company forecasting - summarised to the company level
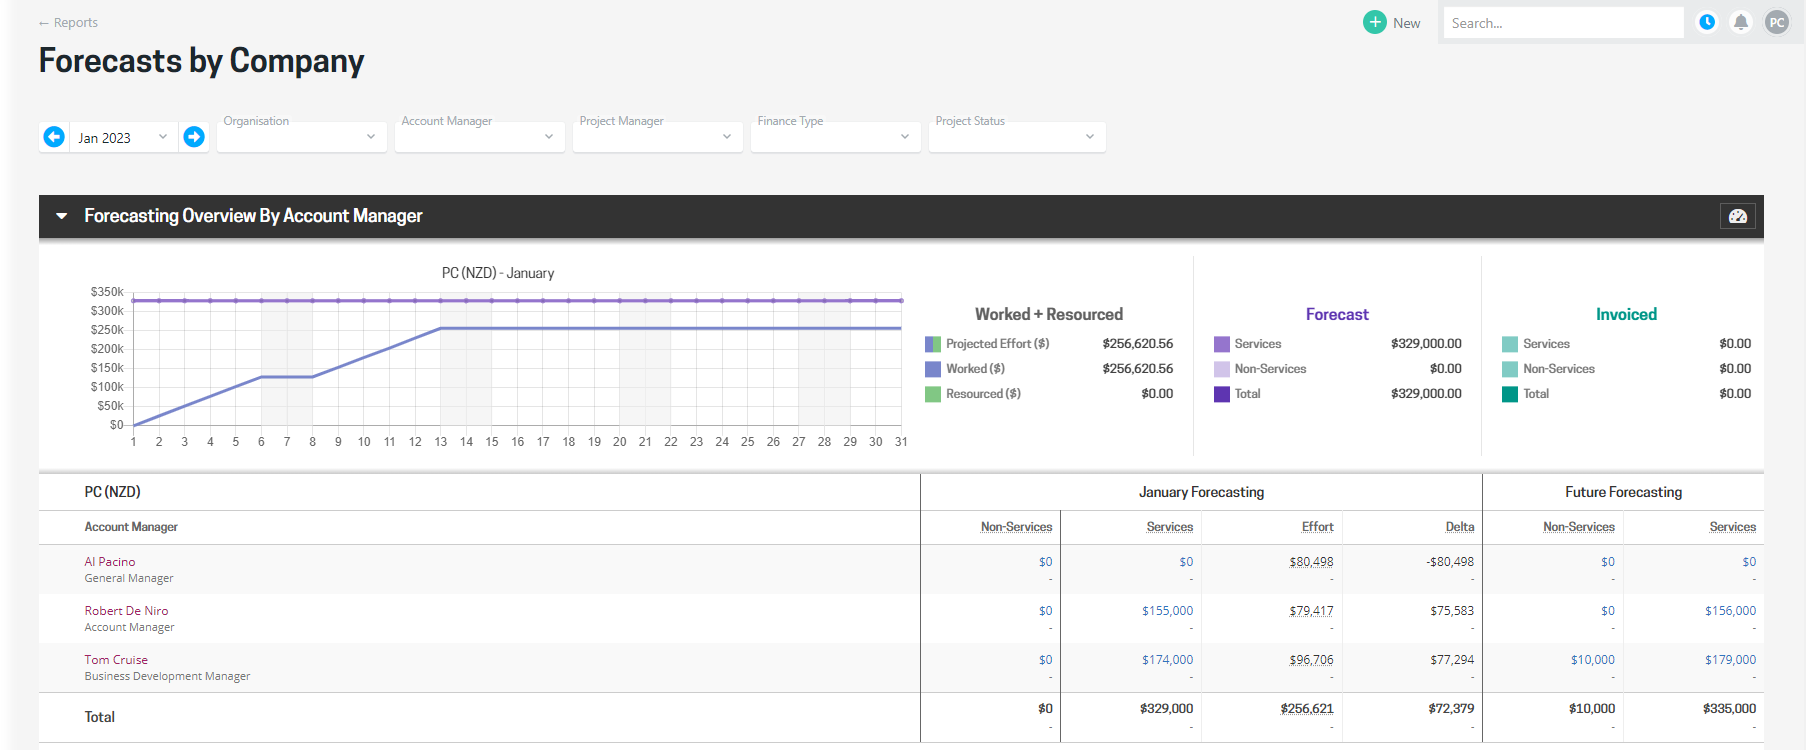
The Forecasts by Company report provides forecast information rolled up to a company level. It is a high-level view and allows account managers to see the forecasting for their portfolio on one screen and identify any companies where there is a delta between projected burn and what is forecast for the month. Highlighting companies where there is a delta between forecasting and projected burn can be a catalyst for account managers and project managers to get together to review the portfolio together.
The report can be filtered by month, organisation, account manager, project manager, finance type, and/or project status. All content in the report is based on which filters have been set, allowing you to take a wide or narrow view.
The Forecasts by Company report is accessed from the Reports menu.
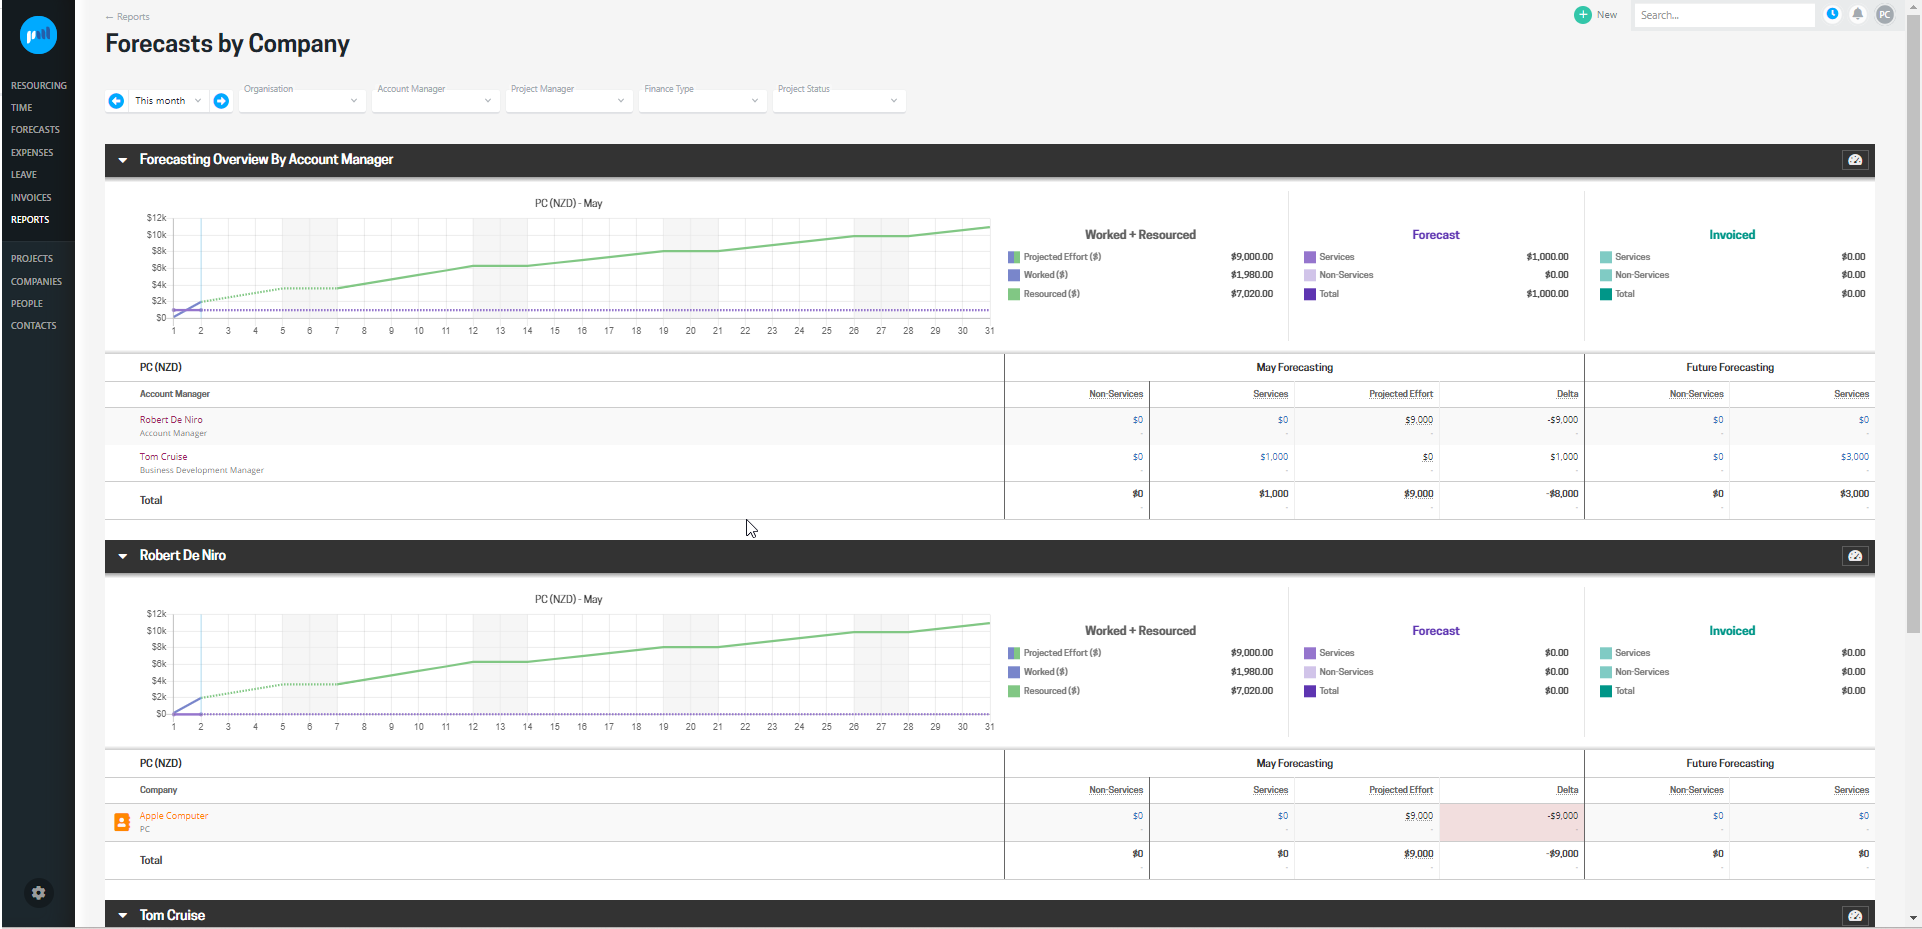
Forecasting information for an individual company can be accessed by clicking the name of the company. This opens the forecasting screen for that company, which shows the forecasts at a project level. See forecasts for an individual company for more details.
Pro Tip: Use the project status filter to see which companies have forecasts which could be risky - they may require attention and action.
The report provides the following information
- Graph and summary data;
- Overview for each account manager;
- Forecast, projected burn, delta, and future forecasting for each account manager;
- For each company, the forecast, projected burn, delta, and future forecasting is shown.
If no filters are set, the overview will be grouped by organisation then account manager, with graphs and data shown for each organisation.
Project forecasting - forecasts summarised to the project level
The Forecasts by Project report provides forecast information rolled up to a project level. It is a high-level view and allows project managers to see the forecasting for their portfolio on one screen and identify any projects where there is a delta between projected burn and what is forecast. Highlighting projects where there is a delta between forecasting and projected burn can make it easier for project managers to know where adjustments could be needed, to either a forecast or project resourcing.
The Forecasts by Project report is accessed from the Reports menu.
Clicking a project name opens the forecasting screen for that project, which is where changes can be made to the forecasts.
Pro Tip: Use the Project Status filter to see which companies have forecasts which could be risky (Opportunity & Committed) - they may require attention and action.
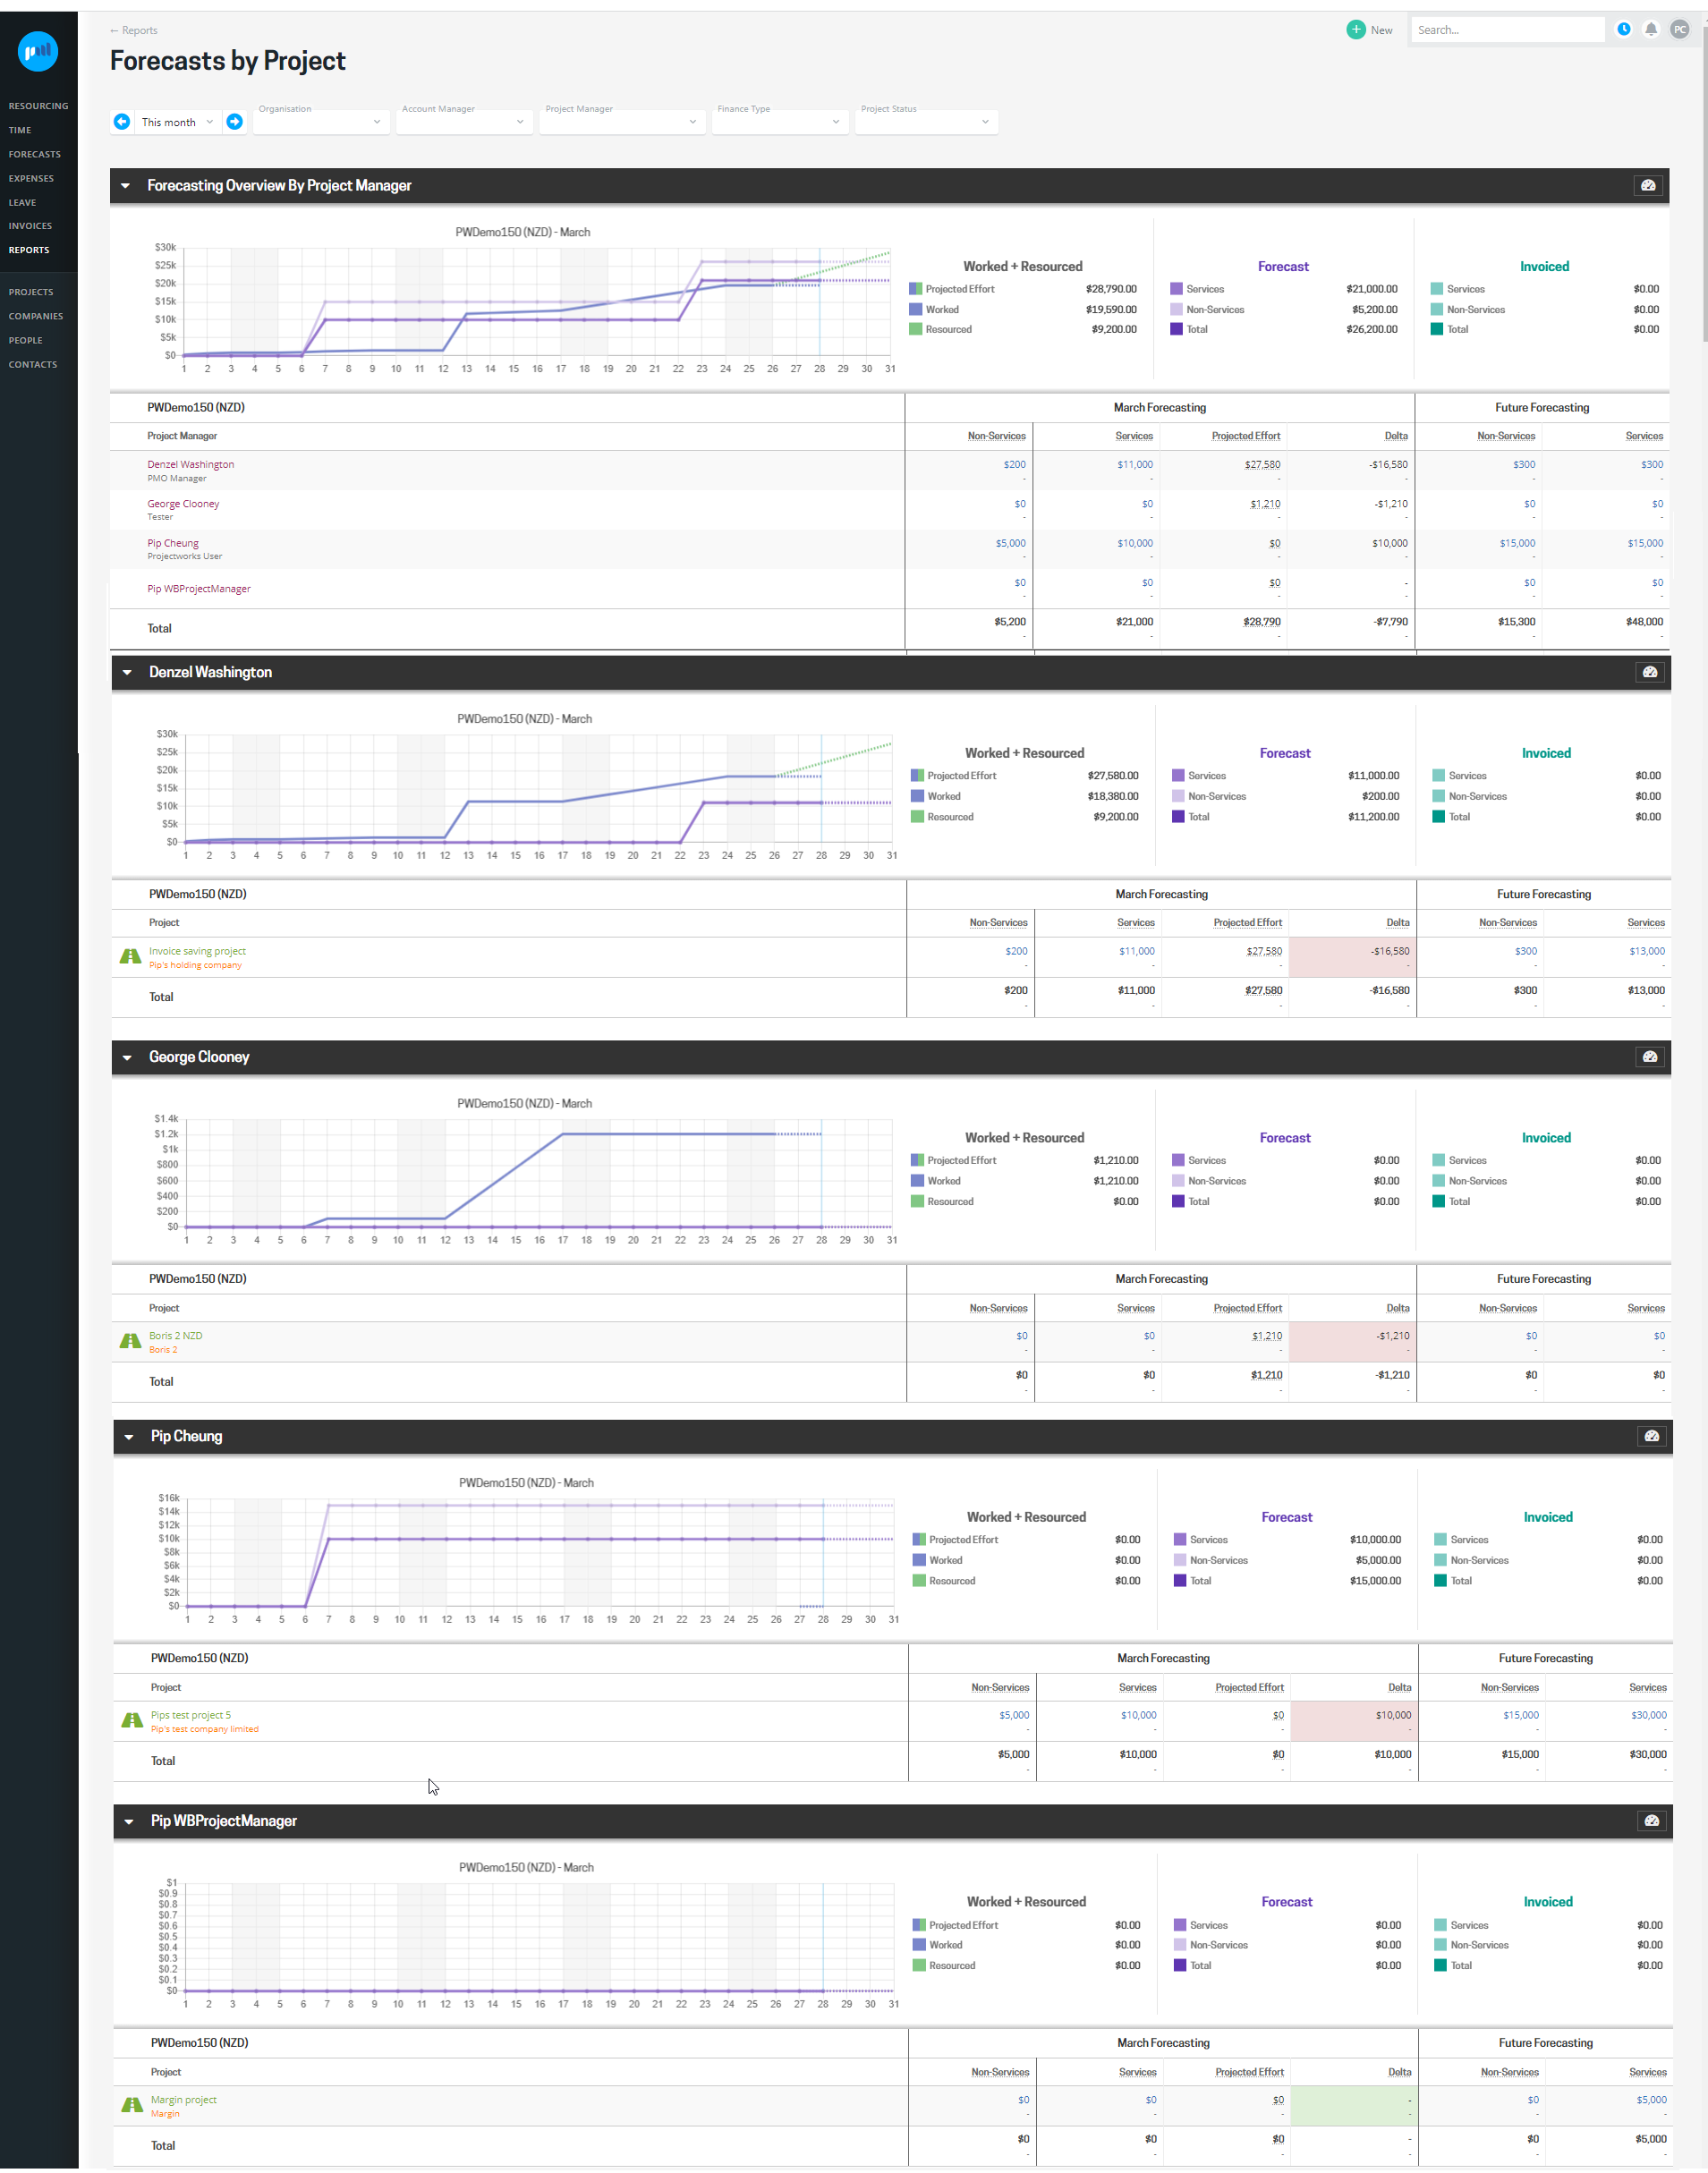
The report provides the following information
- Graph and summary data;
- Overview for each project manager;
- Forecast, projected burn, delta, and future forecasting for each project manager;
- For each project, the forecast, projected burn, delta, and future forecasting is shown.
Note: If no filters are set, the overview will be grouped by organisation, then project manager, with graphs & data shown for each organisation.
Company forecast - forecasts for an individual company
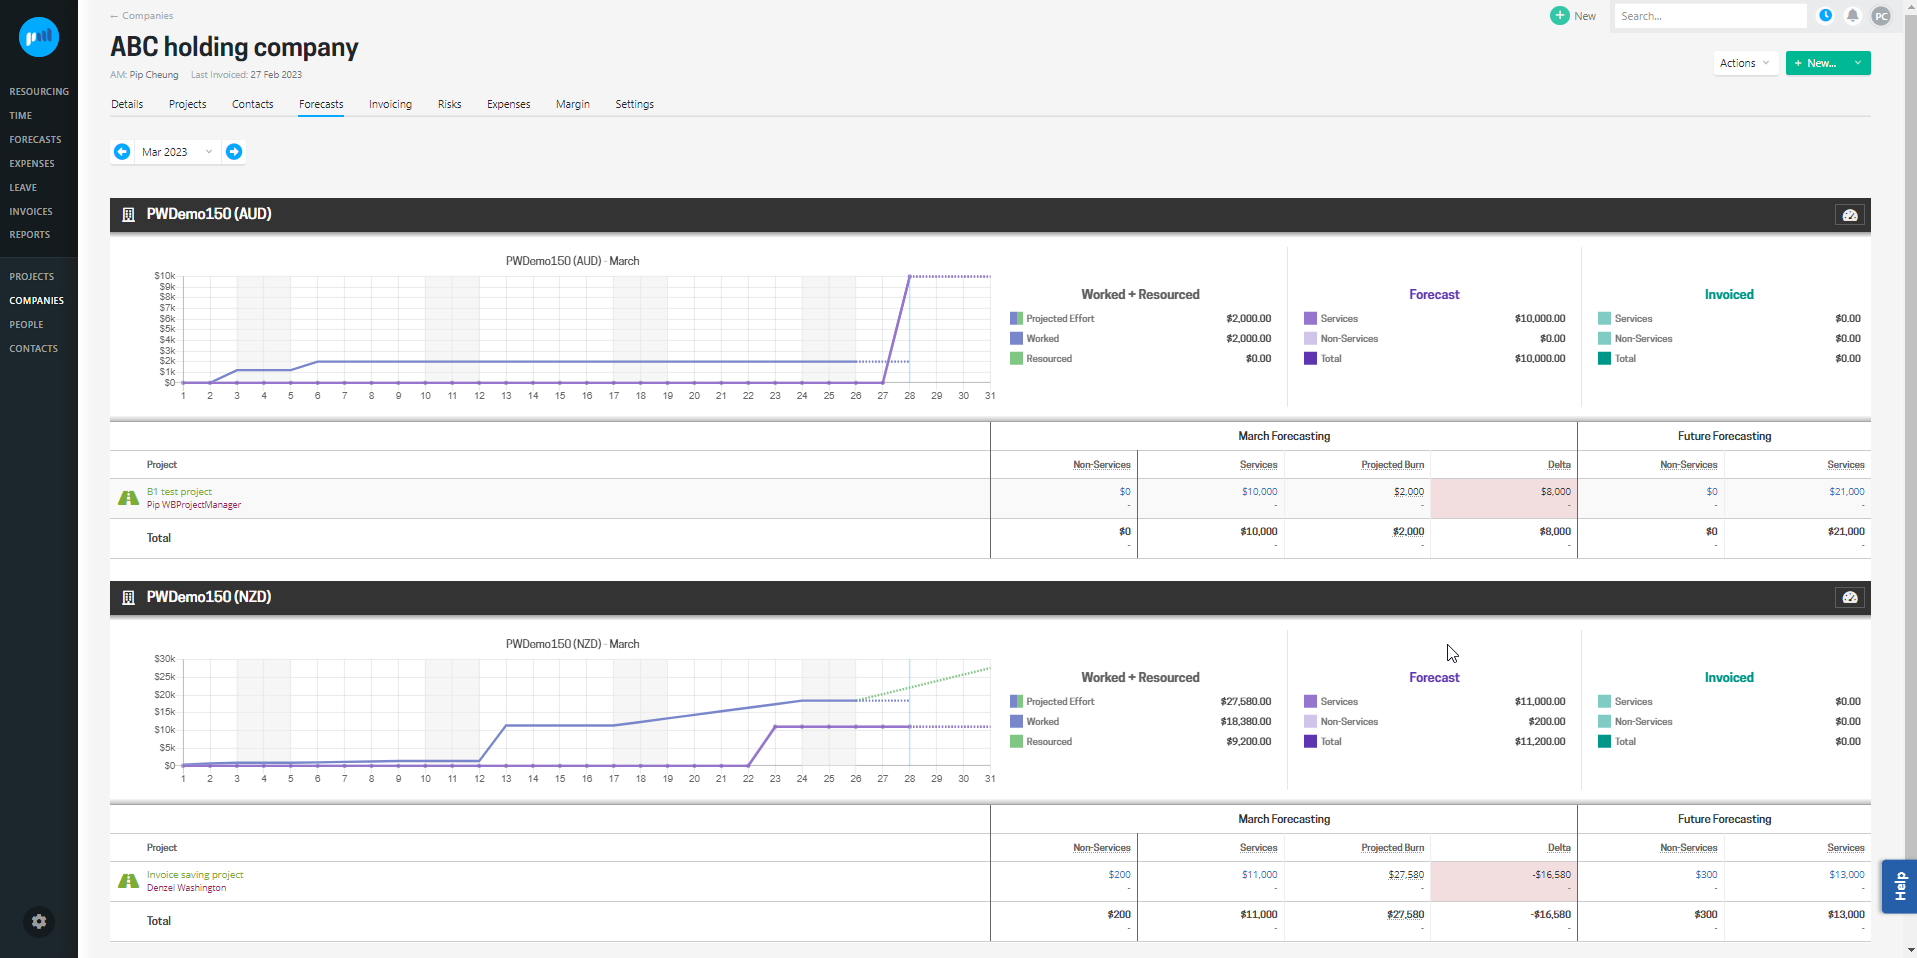
Forecasts for an individual company are shown on the forecasting screen in the workbench for that company. You can get to this screen by clicking the name of the company on the Company Forecasting report, or from the forecasting menu in the company workbench.
The forecasting screen for a company shows the forecasts, projected burn, and deltas for each of the company's projects. This view makes it easy for an account manager or project manager to monitor the forecasts for a company, and identify any projects with a delta between forecasting and projected burn.
The screen provides the following information:
- Graph and summary data;
- For each project, the forecast, projected burn, delta, and future forecasting is shown.
Project forecast - forecasts for an individual project
The forecasting screen for a project presents forecasts at a budget level, the most granular view that is available. This screen is structured differently from the other forecasting screens as this is where project managers maintain the forecasts. As the screen has a different primary purpose, the information is presented differently.
Forecasting information for an individual project can be accessed by clicking the name of the project from the Forecasts by Project report or selecting the Forecasts tab when viewing the project. This opens the forecasting screen for that project, showing the forecasts entered against budgets. Forecasts can also be edited from this screen.
The project forecast shows:
- Forecasts entered against budgets; and
- Forecasts are grouped by services and non-services budgets.
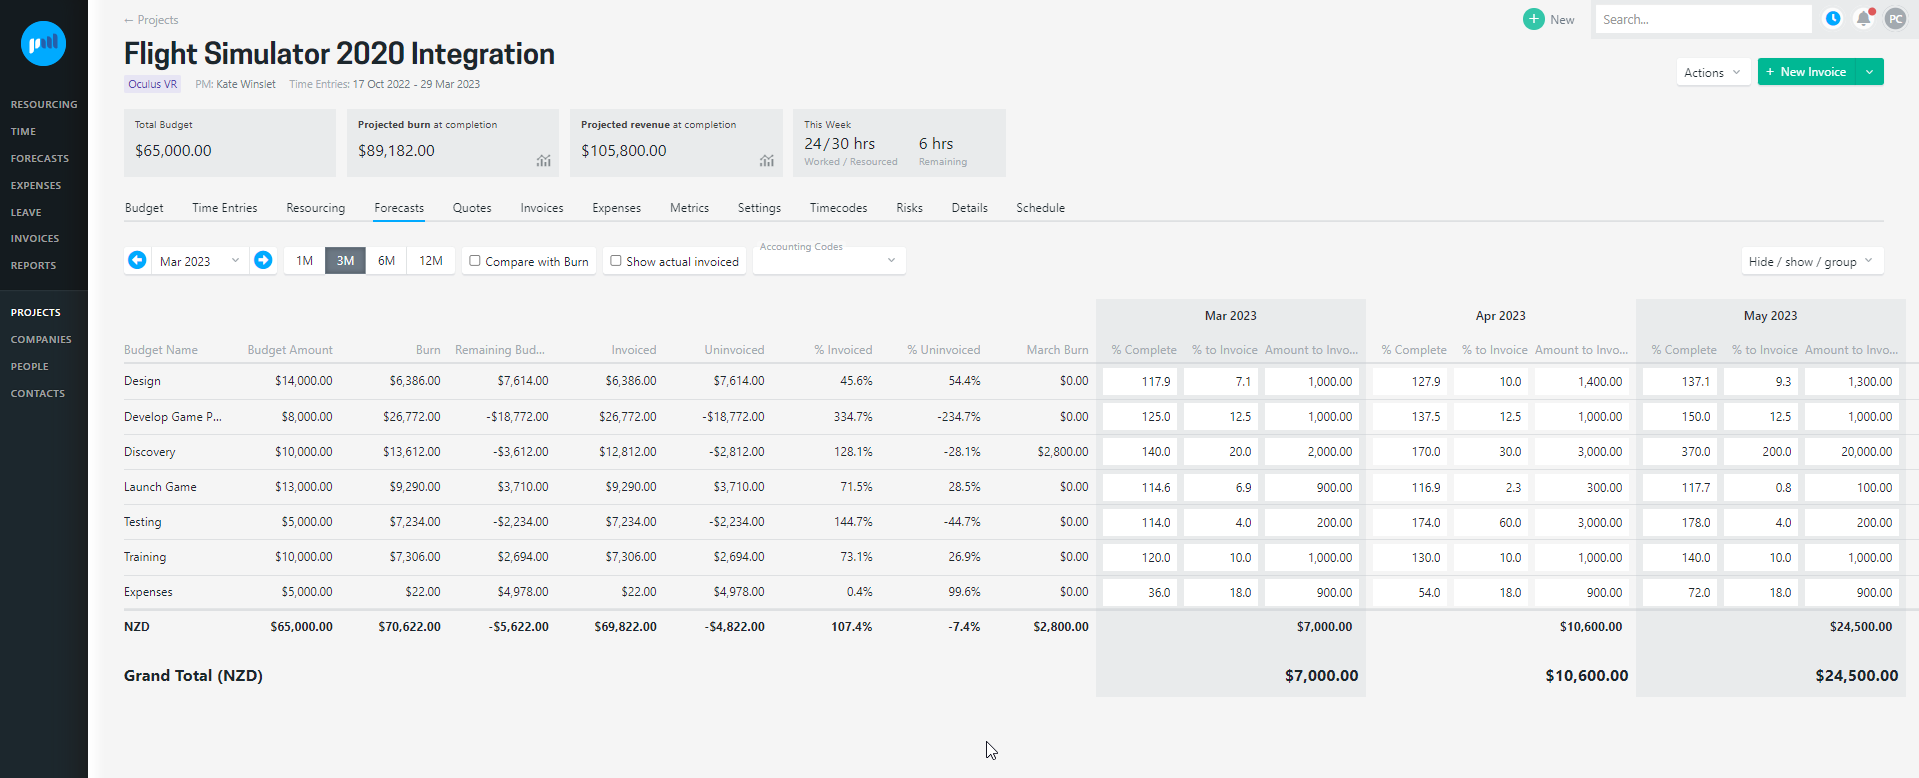
The project forecast can be filtered by account codes for further granularity, and you can choose to compare with burn and show actual invoiced amounts.
Resourcing can’t currently be allocated to a budget, so if the account codes are filtered, you cannot compare monthly forecasts to burn.
Access levels (permissions)
Projectworks administrators can set up access to the forecast screens and reports as required.
-
Forecast screens
-
Users who can view project forecasts will have access to view forecasts at a project and company level, and also access:
-
My forecasts; and
-
All forecasts.
-
-
-
Forecast reports
-
If a user has access to the reports directory view, they must also have access to
-
the forecast by project view for the Forecasts by Project report; and
-
the forecast by company view for the Forecasts by Company report.
-
-
Troubleshooting
I can’t see the graph or summary data
The graph and summary data can be hidden or displayed by clicking on the dashboard icon.