The Monthly Margin report gives you visibility of your projects' margin on time and expenses on a monthly basis.
The Monthly Margin report uses:
-
time, expense and invoice data for projects looking backward at timesheet entries, incurred expenses and invoices; and
-
future resourcing, planned expenses and budget forecasts when taking a forward view;
dependent on the months displayed in the report.
There are a number of filters available to slice and dice the project margin and gain visibility across account manager, project type etc.
See the monthly margin of all projects in one place
The Monthly Margin report is accessed from the Reports menu.
On the first visit to the report the list has been kept simple, showing the monthly margin of each billable project for the next six months. Along with the total margin value, you can see a margin on revenue percentage.
To compare monthly margin with previous months, simply select an earlier month in the date picker.
Project costs
Cost
The cost is the backward view of a project, and includes the cost of all time and expenses logged for each month preceding the current month.
Depending on the project expense settings, the purchase sales tax may or may not be included in the expense cost.
Projected Cost
The projected cost is the forward view of a project from this month onwards.
-
For the current month, this includes:
-
the cost of all time and expenses logged for the current month up to and including today; AND
-
the projected cost of remaining resourcing and future dated expenses logged for the current month.
-
-
For each subsequent month, this includes:
-
the projected cost of resourcing and future dated expenses logged for the month.
-
Project Revenue
Revenue
The revenue is the backward view of a project, and includes the sum of invoices for each month preceding the current month.
Projected Revenue
The projected revenue is the forward view of a project from this month onwards.
-
For the current month, this includes the total sum of:
-
the greater of the invoice values or forecast value for each budget for the current month.
-
-
For each subsequent month, this includes:
-
the sum of all project forecasts for that month.
-
e.g. Current month is May, and Project A has three budgets:
-
Discovery budget this month has forecast of $10,000
-
Development budget this month has forecast of $2,000
-
Testing budget this month has forecast of $0
Two invoices have been raised:
-
Invoice #1 is dated earlier in the month e.g. 3rd May and includes
-
Discovery budget = $3,000 invoiced
-
Development budget = $500 invoiced
-
Testing budget = $0 invoiced
-
-
Invoice #2 is dated later in the month e.g. 30th May
-
Discovery budget = $8,000 invoiced
-
Development budget = $0 invoiced
-
Testing budget = $900 invoiced
-
Project A’s Projected Revenue in the Monthly Margin report for this month on the 15th May = $13,900 i.e.
-
$3,000 PLUS $8,000 (Discovery invoices); PLUS
-
$2,000 (Development forecast); PLUS
-
$900 (Testing budget invoiced).
Project Margin
For each month the margin value is is calculated by subtracting the monthly project cost from the monthly project revenue.
Margin = Revenue MINUS Cost
Projected Margin = Projected Revenue MINUS Projected Cost
Project Margin %
For each month the margin % is is calculated by dividing the monthly project margin by the monthly project revenue.
Margin % = Margin DIVIDED BY Revenue
Projected Margin % = Projected Margin DIVIDED BY Projected Revenue
Customising the view
The report can be customised to your preference, choose which columns you want to see, filter the results and group the projects in a certain way.
Show / hide columns
The report can be customised by using the Hide / show / group options to choose which columns you want to see and how to have the projects grouped.
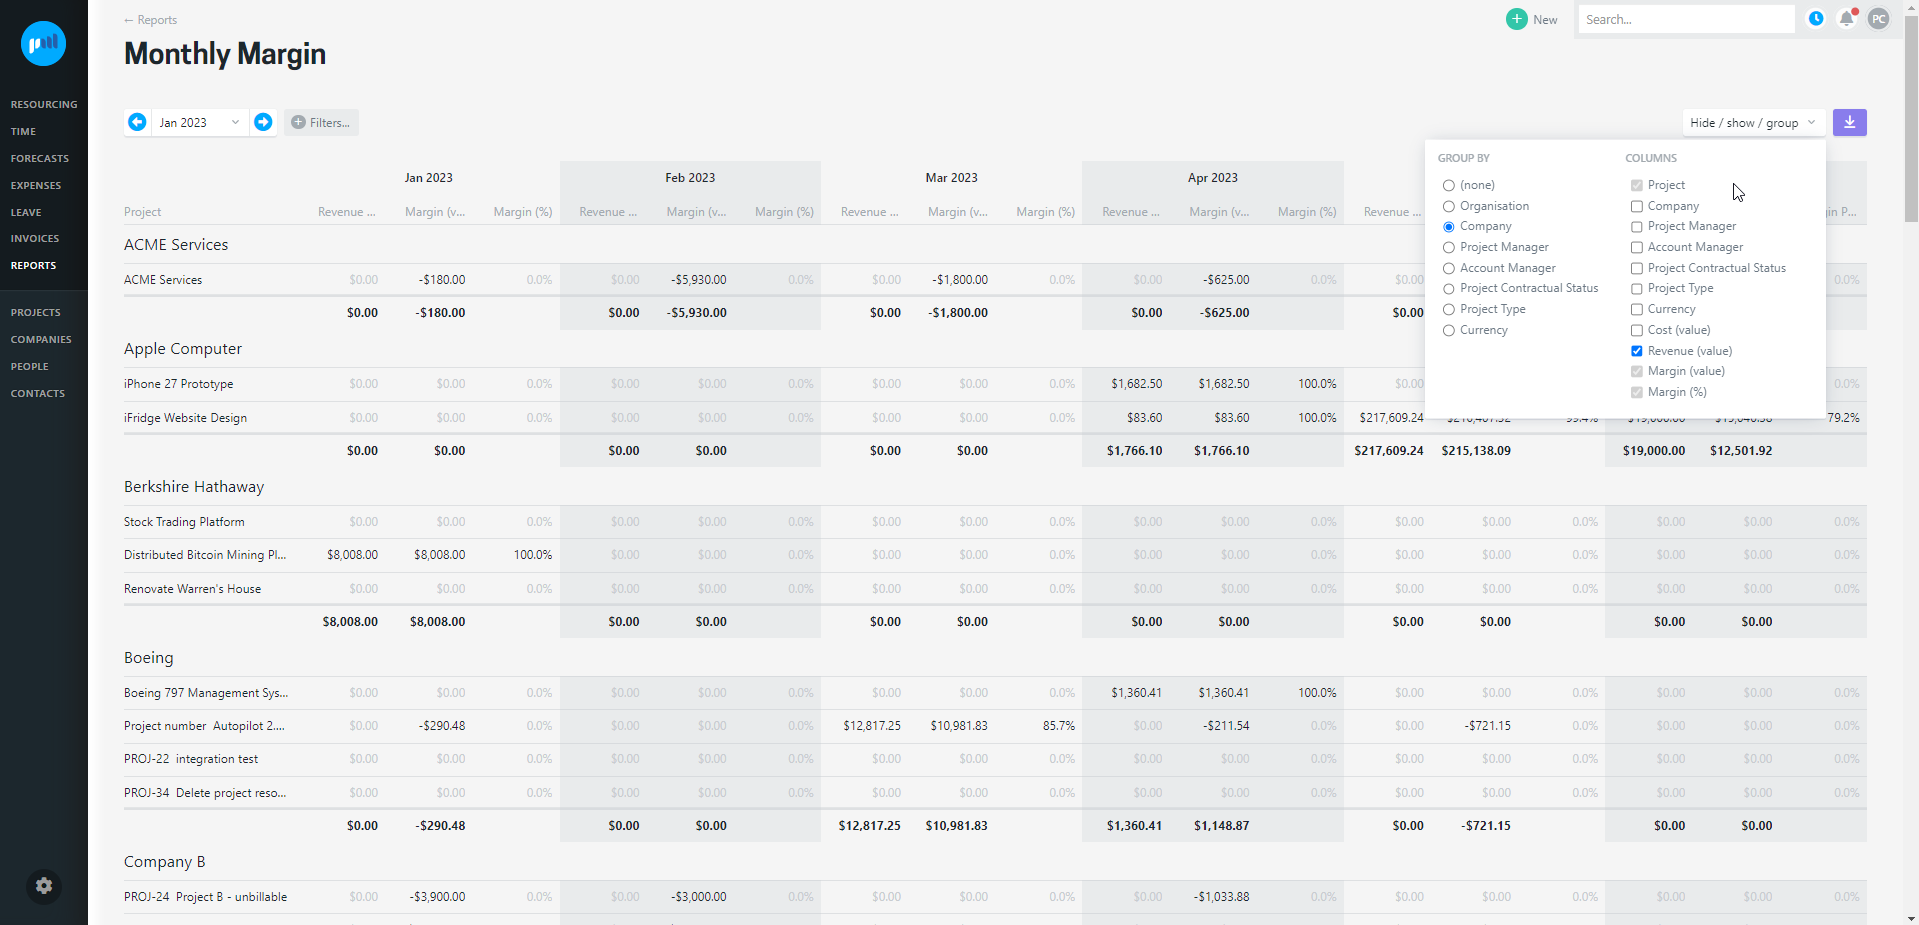
Filtering and Grouping
Use the filters and group by options to tailor the way the projects are presented. Examples you might find useful are:
-
Filtering by Project Manager to see your projects
-
Grouping by currency to see all projects within each currency
You can sort your columns too, just click the column heading to sort based on that.
Controlling access to the report
People can be granted access to the Monthly Margin report, but will also need access to the reports directory to access the report. To see the financial information in the report, they must have an access level that allows them to see dollars.
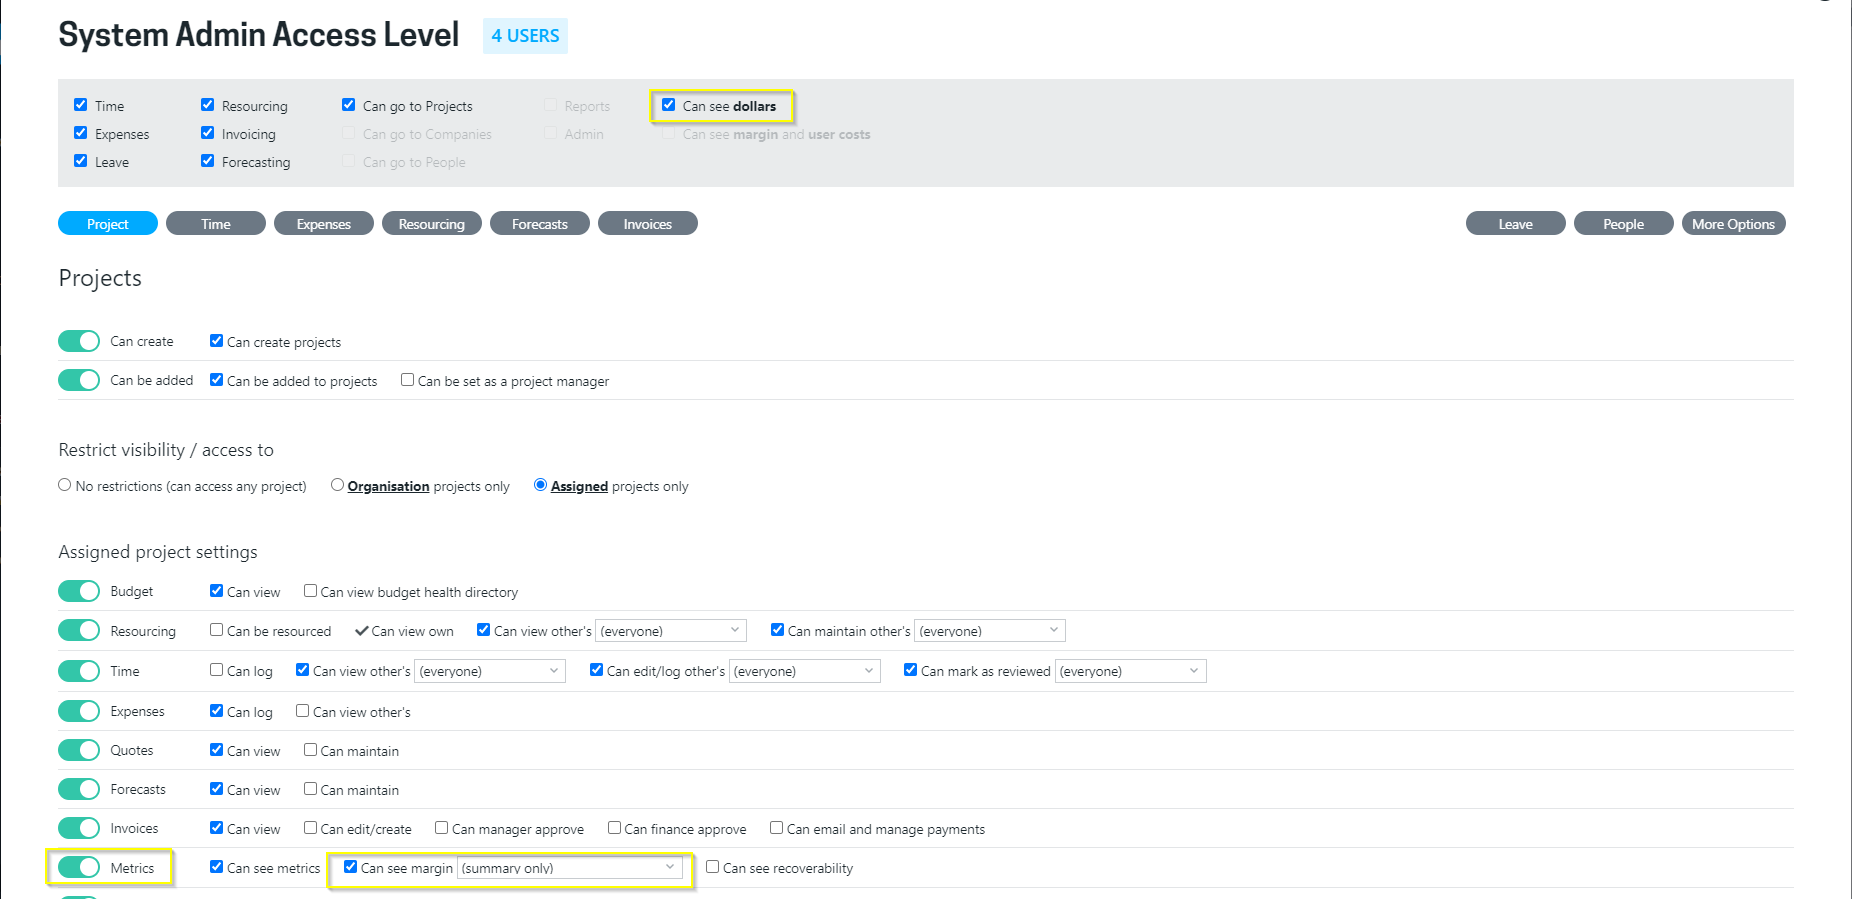
Projectworks administrators
To set up the access levels to allow access to this screen you will need to tick:
-
Can see dollars;
-
Reports.Directory.View; and
-
Reports.MonthlyMargin.View.
Users must also have access to project metrics, and have the option “can see margin” enabled.
Please note: the ability to see margin can be restricted to organisation or assigned projects only, so that you can limit access to the monthly margin report based on a Users role.
Troubleshooting
I cannot see all projects in the Monthly Margin report
Ensure that you have the correct filters selected in the report.
Read more about customising the Monthly Margin report view →
If you have the correct filters selected, you may be limited to only see projects that you are the project manager for. Contact your Projectworks administrator to ensure that you have the correct access level enabled to see all the projects that you need to access to.
Read more about controlling access to the Monthly Margin report →
I do not have access to the Monthly Margin report
Contact your Projectworks administrator to ensure you have access to the Monthly Margin report.
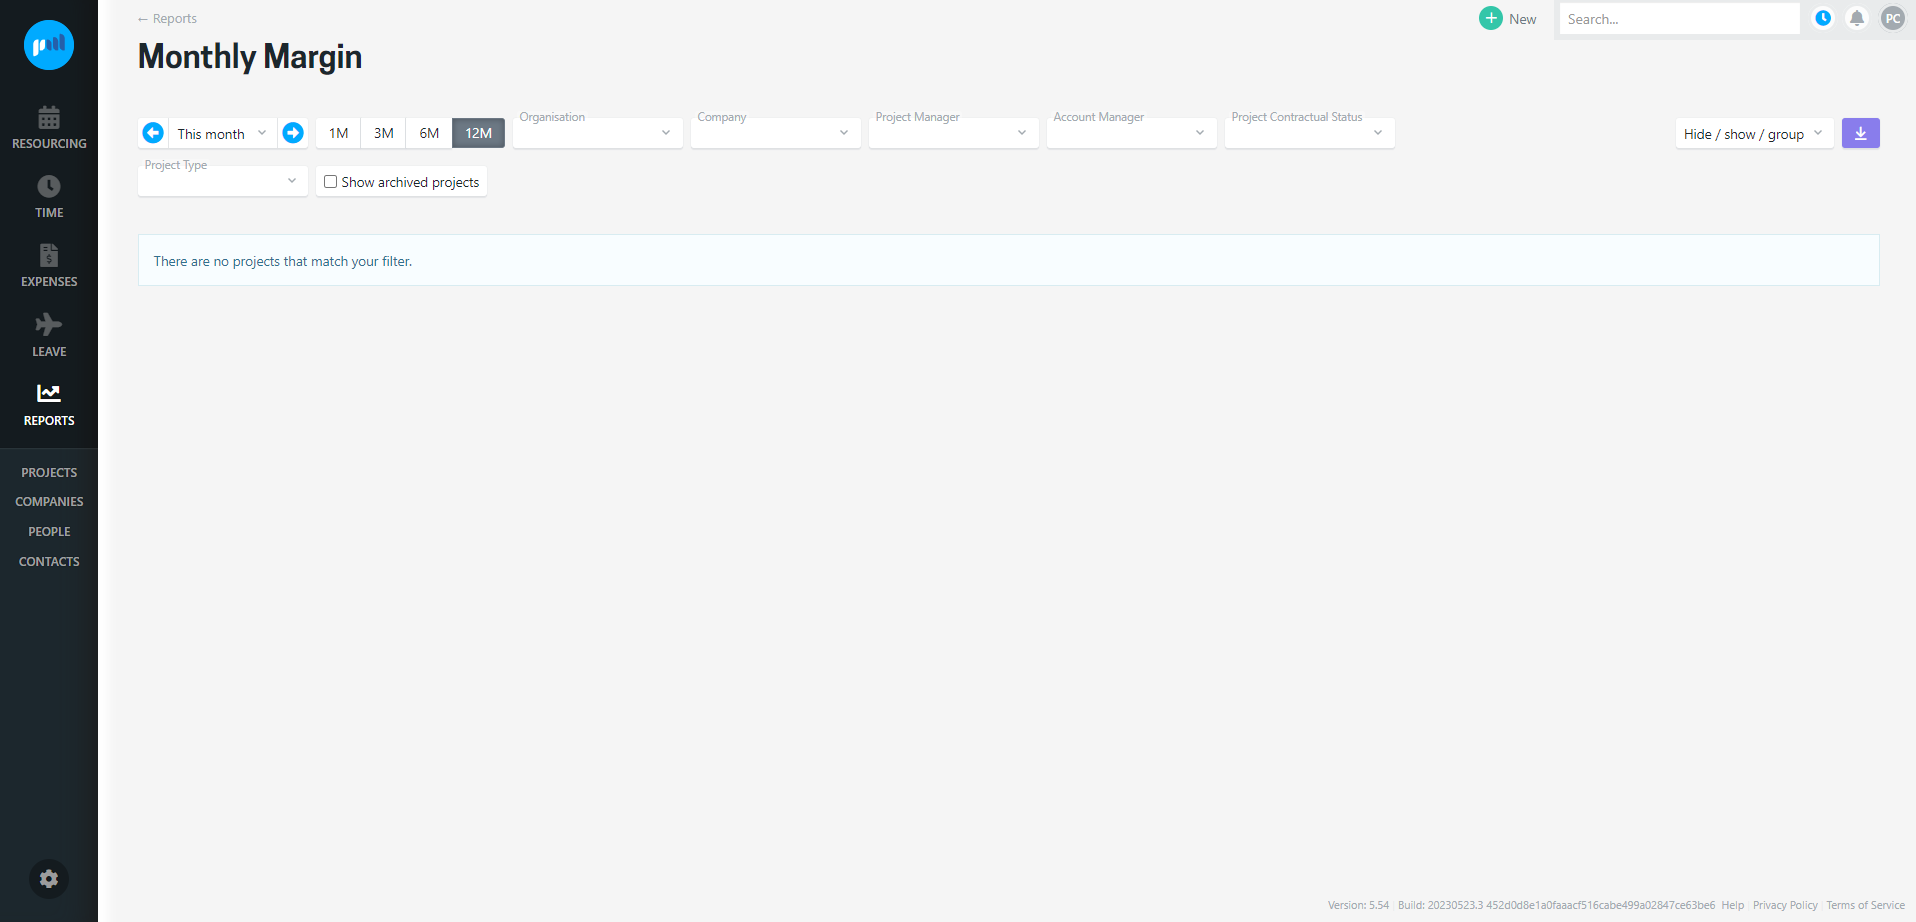
No projects match my filter
In the event that you have access to the Monthly Margin report, but do not have “Can see dollars” or “can see margin” project metrics enabled, no projects will be displayed in the Monthly Margin report. Contact your Projectworks administrator to update your access levels.