The Forecasts vs Budget report lets you measure progress against your company wide revenue budgets. It is primarily aimed at management and the finance team.
The Forecasts vs Budget report provides key information on the progress against a revenue budget for a given month.
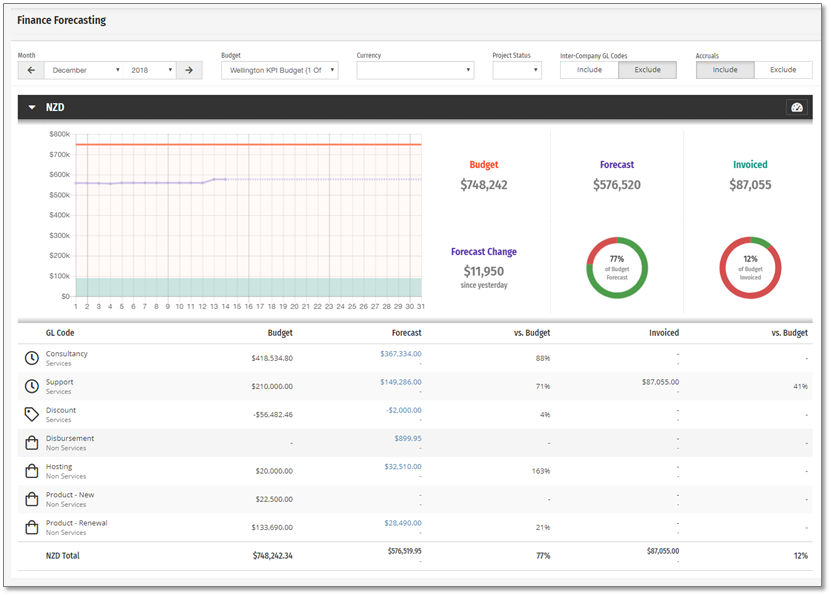
It includes the revenue forecasts entered against GL Codes and the figures from forecasts entered within projects and invoiced amount. The "all up" metrics are presented on a graph, with key totals called out.
Budgets
A fundamental part of the Forecasts vs Budget report is the budget that has been set. The budgets are set up for a financial year and include a monthly budget for each GL Code that applies. Each budget can be linked to one or multiple organisations within Projectworks, and multiple budgets can be created. Linking a budget to an organisation means that forecast and invoicing information can be measured versus the budget (forecasts and invoices apply to projects, and projects belong to an organisation).
The budget amounts are static throughout the year and are shown as the orange line on the graph.
See the Using organisation wide budgets article for details on setting up budgets
Forecasts
Forecasts are entered against project budgets and as each budget has a GL Code associated with it, forecasts are grouped to a GL Code level.
The forecast amounts for each GL Code are updated as forecasts are entered or edited on a project providing real-time monitoring against the company revenue budget. The graph shows the total forecast (all GL Codes) as the purple line, with a snapshot of the forecast plotted for each day of the month to show forecast changes throughout the month.
Each forecast data point on the graph has a hover to show the value for that date. A final metric is a comparison of the total forecast against the total budget The data table below the graph shows the % forecast vs budget for each GL Code, and the donut graph shows the % of the total forecast vs the total budget.
Adjusting to take into account inter-company GL Codes or accruals
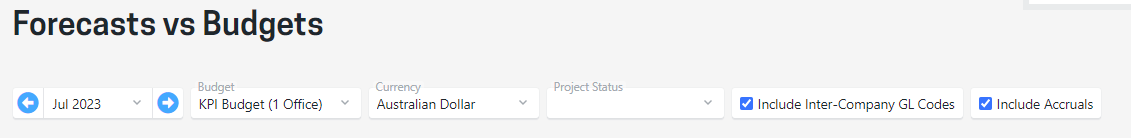
There are two options available which allow the figures to be presented slightly differently, by either including or excluding inter-company GL codes, and or accruals.
Inter-company GL Codes
If your organization is using any inter-company accounting codes you can choose to include or exclude values those values.
Accruals
You can choose to include or exclude accruals from the calculation
Forecast changes
With forecasts potentially being changed at any time, it is important to see what changes have been made. If the total forecast has changed "since yesterday" the amount of the change is shown as the "Forecast change" to the right of the graph.
A changelog is available which shows details of what forecasts have been changed for a GL Code. This is accessed by clicking the forecast amount for the desired GL Code. A Forecast changelog will be displayed, with details of each change shown. The total change for a day is also shown

A changelog is available which shows details of what forecasts have been changed for a GL Code. This is accessed by clicking the forecast amount for the desired GL Code.
- Date of the change
- Company, Project, and Manager names
- Comment the associated with the change
- The original forecast changed the amount and the new forecast
Note: The total change for a day is also shown
Invoiced
The invoiced amount shows the revenue associated with each GL Code (from the budget of each invoice line). Invoiced amount updates throughout the month as invoices are created, based on the Invoice Date.
The graph shows the total invoiced (all GL Codes) as the green area on the graph - the invoiced line raises up the graph as the invoiced total increases. Just like forecasts, the invoiced amounts are measured against the budget, with the data table showing the % invoiced vs budget for each GL Code, and the donut graph shows the % of the total invoiced vs total budget.
- Options to include or exclude Inter-Company GL codes and Accruals
- The forecast change log can be accessed by clicking the forecast amount for a GL Code in the table