The Project Financials and Budget Financials provide an overview of financial positions against budgets and projects. This allows you to easily identify what is currently over budget, and if anything is projected to go over budget in the future.
See the budget position of multiple projects in one place
The Project and Budget Financials screens can be found in the main Projects section. If you have access to either screen you can see them in the main navigation flyout, and the tabs in the Projects section.
Read more about getting access to the Project and Budget Financials screens →
On the first visit to the screen the list has been kept simple, showing the current financial position of the project. Along with the budget, columns relating to the current burn are shown:
Current burn
-
-
Worked (value): value of billable time entries to date
-
Incurred Billable Expenses (value): value of billable expenses to date
-
Burn (value): Worked + Incurred Billable Expenses
-
Burn (%): Burn divided by Budget
-
Burn (Progress): Burn % as a graph
-
The Budget Financials screen does not include specific Worked or Incurred Expenses columns, as each Budget only includes time or expenses, so these columns are represented in the Burn column.
Customising the view
Each screen can be customised to your preference, choose which columns you want to see, filter the results and group the projects in a certain way.
Show / hide columns
The screen can be customised by using the Hide / show / group options to choose which columns you want to see and how to have the projects, or budgets, grouped.
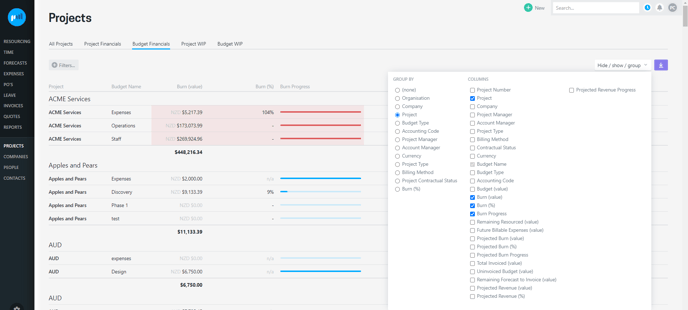
You can also turn on other columns to get a sense of burn and revenue.
Projected Burn
- Remaining Resourced (value): billable value of all future resourced hours
- Future Billable Expenses (value): billable value of future dated billable expenses
- Projected Burn (value): Burn + remaining burn (time & expenses)
- Projected Burn (%): Projected burn divided by budget
- Projected Burn Progress: Projected burn % as a graph
Revenue
- Total Invoiced (value): Total invoiced amounts included in manager and finance approved invoices
- Remaining Forecast to Invoice (value): Total future forecasts (to be invoiced)
- Projected Revenue (value): Total Invoiced + Remaining Forecast to Invoice
- Projected Revenue (%): Projected Revenue divided by Budget
- Projected Revenue Progress: Projected revenue % as a graph
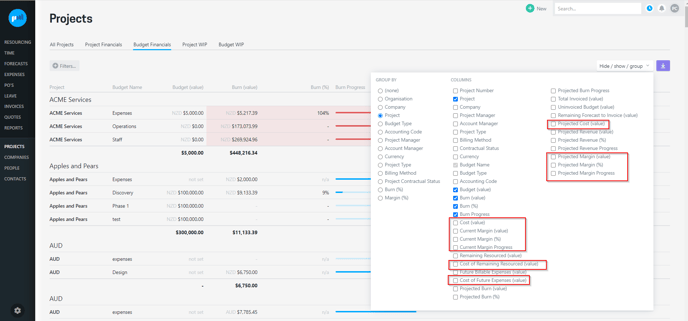
Margin
Margin data is currently behind a beta flag.
Read more about how to enable the Project and Budget Financials Margin (beta) →
Users who have the “Can see margin” permission can see these columns. Columns available:
-
Cost (value): cost of time + cost of billable expenses for each project (or budget) to date
-
Current Margin (value: Total Invoiced - Cost
-
Current Margin (%): Current Margin divided by Total Invoiced
-
Current Margin Progress: Current Margin % as a graph
-
Cost of Remaining Resourced: cost value of all remaining resourced hours
-
Cost of Future Expenses: cost value of all future dated expenses
-
Projected Cost (value): Cost + Cost of Remaining Resourced + Cost of Future Expenses
-
Projected Margin (value): Projected Revenue - Projected Cost
-
Projected Margin (%): Projected Margin divided by Projected Revenue
-
Projected Margin Progress: Projected Margin % as a graph
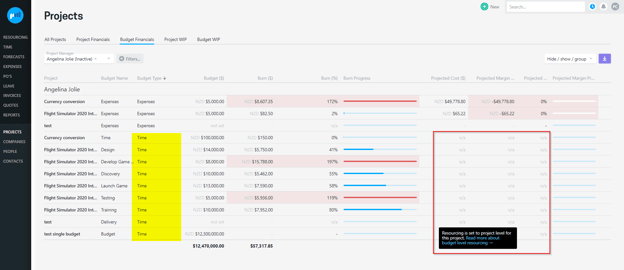
Projected costs and margins cannot be calculated for the Budget Financials time budgets unless resourcing is set to budget level resourcing.
The projected cost and margin values for the time budgets that are set to project level resourcing will be denoted with “n/a”.
Read more about project margin (profit/ loss) →
Filtering and Grouping
The screen can be customised by using the Hide / show / group options to choose which columns you want to see and how to have the projects, or budgets, grouped.
Use the filters and group by options to tailor the way the projects, or budgets, are presented. Examples you might find useful are:
-
Filtering by Project Manager to see your projects or budgets
-
Grouping by Burn % to see all projects, or budgets, within each of the burn bands
Grouping your projects by burn % is a useful way to see project or budgets that are over budget, down to projects or phases of a project (budgets) that may not have started, or made minimal progress.
All columns can be sorted too, just click the column heading to sort based on that.
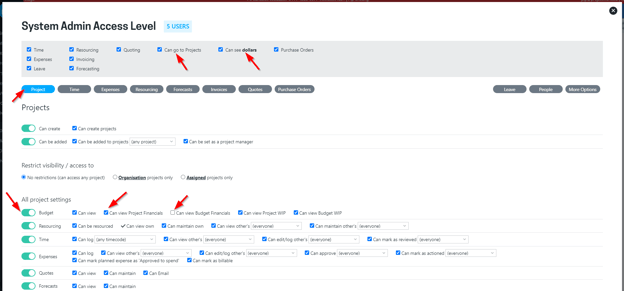
Controlling access to the screen
All people with an access level that allows visibility of projects and ability to see dollars (financial information) can be granted access to the Project Financials and Budget Financials screens.
Projectworks administrators
To set up the access levels to allow access to this screen you will need to tick:
- Can go to projects
- Can see dollars
Some people may require different access levels across the Project and Budget Financials screens:
-
Enable access to the Project Budget
-
To access the Project Financials screen, Project > ‘Can view Project Financials’ must be enabled
-
To access the Budget Financials screen, Project > ‘Can view Budget Financials’ must also be enabled
-
Only projects a person is allowed to see will be included. When setting up access levels there are options to allow access to:
- all projects
- all projects you are the Project Manager for
- only projects in that person's organisation
- only projects you are assigned to
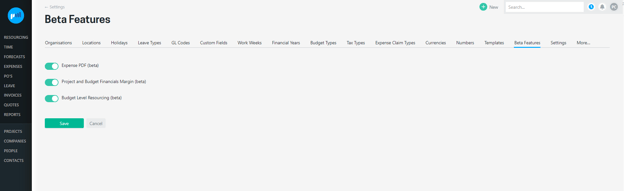
Margin data is currently behind a beta flag. If you would like to include margin in these screens, Projectworks administrators must enable the beta feature. Go to:
Settings > System > Features > Project and Budget Financials Margin (beta)
If you have the “Can see margin” permission for a subset of the projects that are displayed in the Project or Budget Financials screen, and the Project and Budget Financials Margin (beta) feature is enabled, you will only be able to see the values of the above for projects you have access to, otherwise the values will be displayed as “-”.
Troubleshooting
Projected margin for the same project is different
If you are grouping the Budget Financials screen by project, you would expect that the total projected cost and margin values would reflect those for the project in the Project Financials screen. However, if the project is resourced at a project level, the projected margin cannot be attributed to a specific time budget, so is not included in the Budget Financials screen. Projects with resourcing set to budget level resourcing will have the same projected costs and projected margin total values.
Read more about budget line resourcing →
I can see margins and costs for some projects and budgets, but not others
Dependent on your access to see margins, you may only be able to see the costs and margins for some projects.
Contact your Projectworks administrator if you should have access to cost and margin information for all projects.